An Honest Review of Tempdrop (Revised Review 2021)

Are you looking to simplify your basal body temperature charting routine? Is getting up in the morning just too hard to remember to take your temperature? Read on!

There are currently a few wearable basal body thermometers on the market such as iFertracker, Ava, and Tempdrop. In this blog, I will review the Tempdrop device. If you decide to purchase, use this link and get 10% off the device.

Unboxing Tempdrop!

Tempdrop is a wearable basal body temperature thermometer that came onto the market in 2017. Rather than setting an alarm, you can simply put this thermometer on before bed. You wear it around your upper arm (and it may be worn in a bra as well). It needs 3 hours of sleep to determine your basal body temperature. The device uses an algorithm to find your true temperature, regardless of how many times you have gotten up or whether you had restless sleep this night.

This device is very popular with shift workers, breastfeeding folks, and other people who don’t get a regular amount of sleep and wake up at different times, or just to those who don’t want to set an alarm!

Tempdrop holds 24 hours of data, and it must be synced at least every 24 hours or you will lose previous data. After wearing it for 15 days (as of March 2020), the algorithm will kick in. (If possible you should back up temp with oral basal body temperature for the first 60 days if you are avoiding pregnancy. If not, use a different method of protection). By day 60, the device will only change and make improvements to the last 2 temperatures taken.

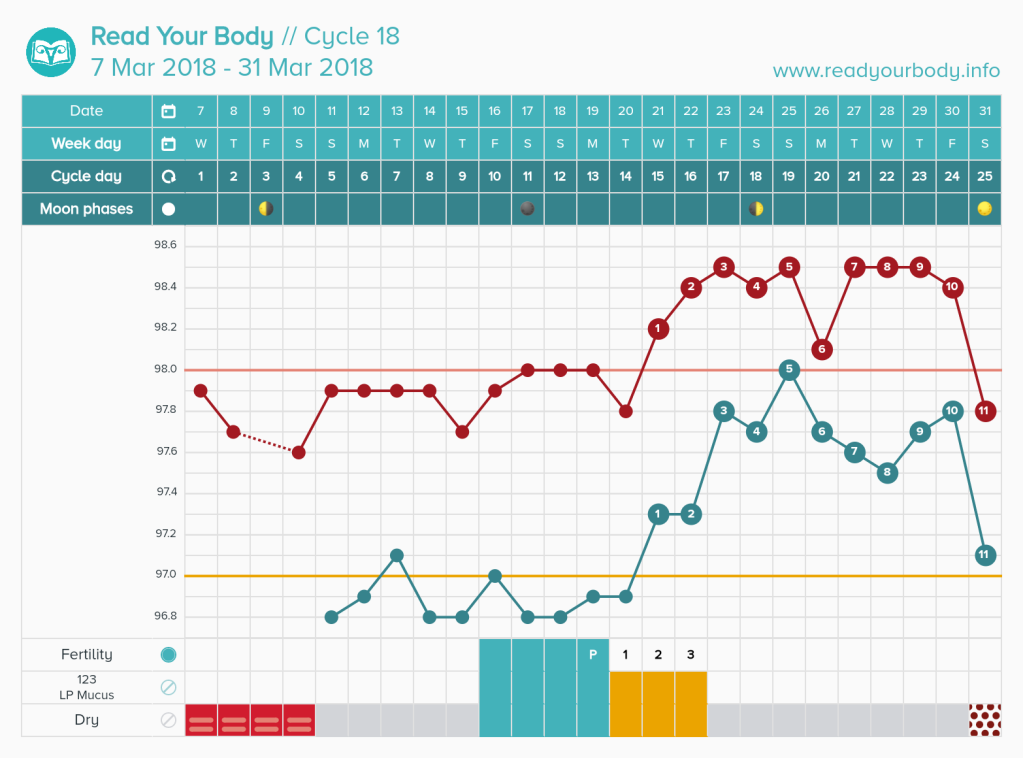
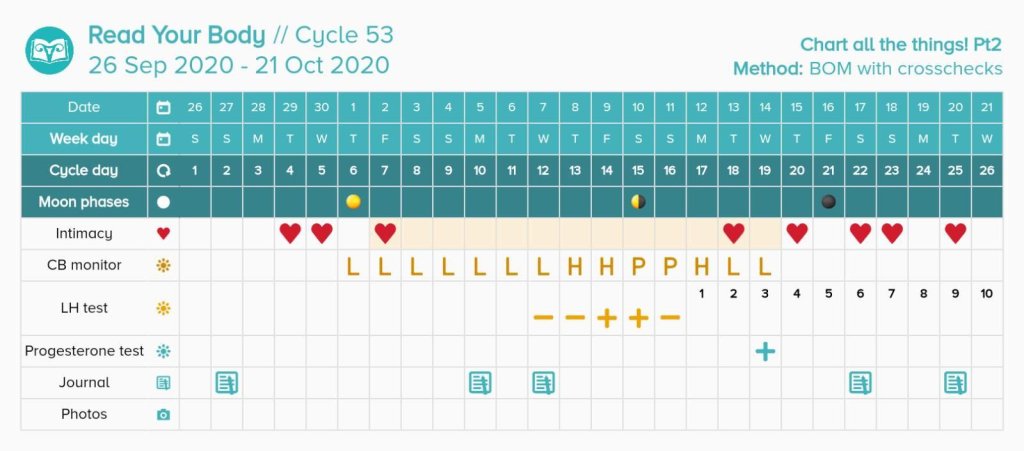
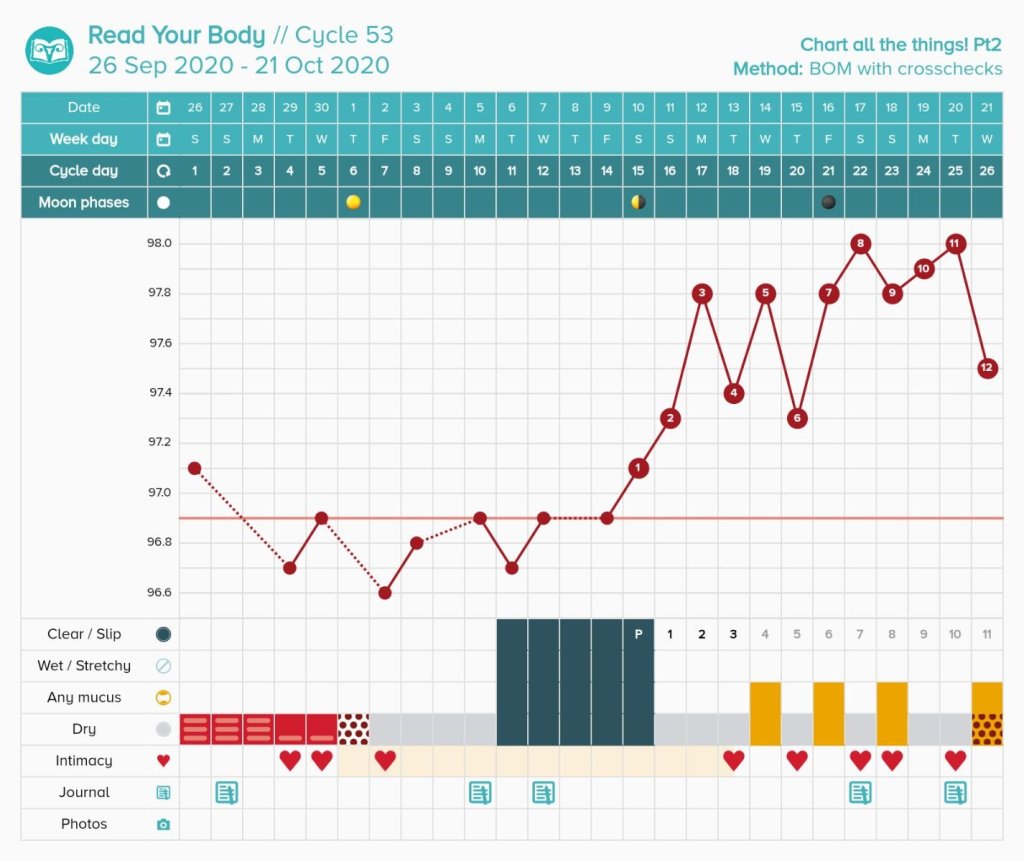
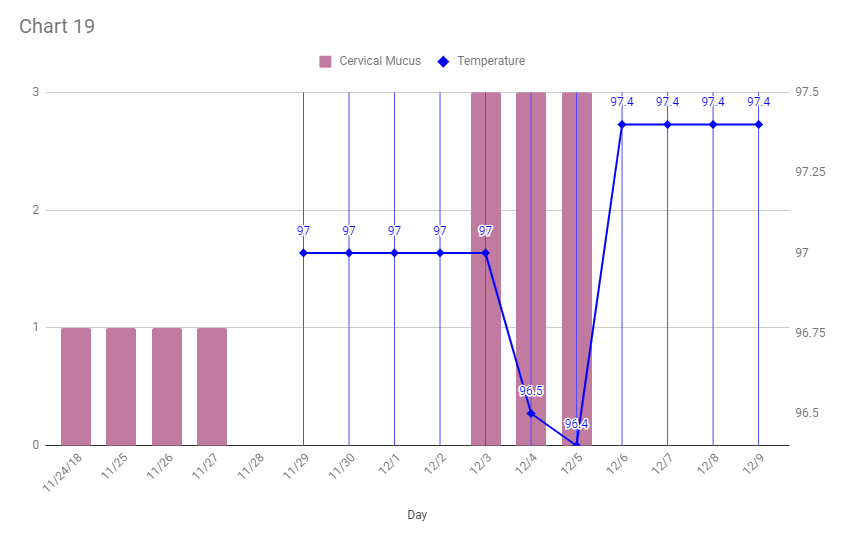
Once you wear it, you will need to sync it to an app to see your temperature. Tempdrop has its own app, but I highly recommend using Read Your Body (pictured below) instead! This app is customizable for every method and can be synced to Tempdrop.

My Experience with Tempdrop

Tempdrop is red and oral temperatures are blue! One perk of oral temperatures is that sometimes I can skip taking my temperature, while with Tempdrop you do wear it daily for best results.

I used the Tempdrop device for almost 12 months. I found my oral temps to be more predictable and more steady when observing my own trends over time. I get very steady or repeating temperatures with oral charts most of the time.

However, I am not a shift worker, so I will admit that I do not need Tempdrop like some people may do. I already have to wake up at the same time 5 days a week, and I don’t find it inconvenient to take my temperature on the weekend. My oral temperatures caught my shift earlier than Tempdrop did on two separate occasions. I have seen other people say that Tempdrop catches their shift sooner than oral temperatures, so this is really an individual thing.

I discovered that there were multiple other effective ways of charting without taking my temperature. If you really want to chart in shift work, irregular cycles, postpartum and you do not want to purchase the Tempdrop, I highly recommend considering learning a new method of fertility awareness like the Billings Ovulation Method (click here to learn about working with me) and Marquette method (click here to learn what charting with Marquette is like).

If you are dedicated to using a sympto-thermal method and can’t get accurate temperatures otherwise, and you have tried trouble shooting your routine (vaginal temperatures, pre-warming the thermometer before taking it, using longest stretch of sleep), then Tempdrop may be your best option. You can use my code for 10% off, and I will get a small kickback. Thank you for using my code!

Here is what the device looks like!

One Cycle Seven Ways: Experimenting with Marquette (Clearblue Monitor), Billings Method, Sympto-Thermal, Daysy, Kegg, DOT, and more!

Over the last several months, I have been testing multiple femtech products (such as Daysy Fertility Tracker, Kegg, DOT) and comparing them to charting methods like Marquette, Billings Ovulation Method, and Sympto-Thermal (NFPTA). These products and methods rely on different fertility signs such as basal body temperature, cervical mucus, urinary hormones, electrolyte levels, and calendar dates.

Disclaimer: Do not attempt to learn to chart using this post. My own experience may not reflect your unique cycles. My fertility intentions may not be your intentions.

Keep in mind that different methods may change safe days over time. The following data is only a snap shot of what fertility windows for avoiding pregnancy could look like. In particular, the Daysy thermometer only has 4 cycles of data on me.

Expected Consecutive Abstinence Over 3 Cycles

Cycle 52

  • Billings Ovulation Method: 15 (9 consecutive)
  • Marquette: 13
  • Sympto-thermal: 16
  • DOT: 12
  • Daysy: 15

Cycle 53

  • Billings Ovulation Method: 14 (8 consecutive)
  • Marquette: 13
  • Sympto-thermal: 13
  • DOT: 12
  • Daysy: 14

Cycle 54

  • Billings Ovulation Method: 16 (9 consecutive)
  • Marquette: 15
  • Sympto-thermal: 19
  • DOT: 12 (EXTREMELY RISKY)
  • Daysy: 15

From this data, you can see that sometimes the amount of expected abstinence does not differ from method to method, and sometimes it differs a whole lot! On my last cycle with DOT, it ended my avoidance window on the day after peak fertility occured. Fertility is still potentially high on the 3 days following this date.

Billings method almost always had the least consecutive abstinence because it relies on real-time fertility signs to open the window. However, because it rejects calculation rules and relies on one primary sign, only alternative evenings are ever allowed for pre-ovulatory sex. In addition, heavy days of menstruation are not allowed due to the possibility of early ovulation, and the bleeding obscuring the opening of the fertile window.

Other methods like Daysy, Sympto-thermal, DOT, and Marquette do allow pre-ovulatory consecutive sex, but most of that falls during menstruation for my cycle ranges (25 to 30 days).

Whatever method works best for someone is very dependent on their lifestyle and what someone is willing to diligently track.

The Same Chart Seven Ways

The highlighted days represent days to not use in order to avoid pregnancy with these methods.

My hearts are left on to show the fertile window and for authenticity. Do not use these charts to try to learn the rules of any method or to determine when sex is safe. You will see some broken rules based on my own personal intention level and on the fact that not all fertility signs will show the same window.

The Billings Ovulation Method draws the fertile window based on vulva sensation and cervical mucus. Any heavy bleeding is considered potentially fertile because it obscures readings and ovulation can always happen early. It requires alternating evenings for sex during the established basic infertile pattern.
This is the Marquette Method while using only urinary hormones and calculation rules. Fertile window opening determined by calculation rule based on last 6 cycles or first “H” reading on the Clearblue monitor. Clearblue measures estrogen and luteinizing hormone. My first window is also closed by a progesterone test in addition to meeting PPHLL rules.
This is the double-check sympto-thermal method per Natural Family Planning Teachers Association (NFPTA) rules. It opens the fertile window based on the shortest cycle in the last year minus 20. It closes the fertile window based on cervical mucus and basal body temperature.
This is a chart with the Daysy Fertility Tracker. This basal body thermometer learns your patterns over time and opens the fertile window based on past cycle data. The fertile window changes with time, and this is technically my 3rd Daysy cycle. Caution days and Red X days are for avoiding intercourse. Daysy does not allow the user to mark temperatures questionable, but I have marked two days questionable because I drank alcohol or had the heater on.
This example chart includes my cervical mucus notes for more context. DOT is a calendar based method that looks at the last 12 cycles of data. Only people in regular cycles can use DOT. Black moons are days available for intercourse based on the calendar method. In the next line, I also have included Kegg. Kegg predicts ovulation for trying to conceive purposes only, so I am including it as a bonus comparison. By reading the electrolyte levels in my cervical mucus, it determined that these 3 days were the most fertile days of the cycle. A full Kegg review is forthcoming in December 2020.
This is a resting heart rate chart. Resting heart rate has been shown to correlate with the menstrual cycle. I convert my heart rate like this: 69 = 96.9, 70 =97.0, 71 = 97.1, etc to be able to fit it onto the graph. You can see that it very closely followed my ovulatory pattern.
Here is my chart with all the data in one. It is so cool how different fertility signs draw the fertile window!

Unfortunately, my Mira Fertility sticks were flawed, so I had to remove that data from this experiment. In the future, I will do a comparison post also using this device. I am currently still testing the Kegg device, and a review with full Kegg charts is forthcoming in December. Kegg cannot be converted to display on the Read Your Body app, so I could only include the fertile days in this post.

Do you have any questions about all of these methods?

Consider coming to my free Instagram Live on femtech on November 28th. You can find me @chartyourfertility.

On December 12th, I’m offering a “pay what you can” introduction session that is minimum $5 to $30 USD on regular FABM methods and what the main differences are. Reach out to me if you would like to come.

Finally, a special shout to the Body Literacy Collective and the Read Your Body app for making this post possible by creating the most versatile charting app on the market!

Top 3 Fertility Awareness Mobile Charting Apps

One of the first steps many women take when starting their charting journey is downloading a period app. However, not all apps are created equal. A quick search in the app store comes up with dozens of apps. Sadly, very few of them are suitable for those using NFP or FAM. Most are just forms of the rhythm method, an unreliable from of birth control that comes up with predictions based on past cycles. My review only includes apps that allow women to track cervical mucus and basal body temperature–the two main signs in SymptoThermal Methods. I also tried to only pick apps that allowed self-interpretation. Learning how to interpret your own fertility signs is vitally important when charting.

1. Kindara

kindara2

Available on Android and iPhone.

Perk: The iPhone version allows users to share their whole chart.

Con: The Android version is known to be considerably more glitchy than the iPhone version. On Android, users can select “Share This Chart” and “With Community” to access a screen where they may screenshot their own chart.

Cost

Perk: Free Version Available

Con: Vaginal Sensation and more than four categories are extra. Premium version is $4.99 USD/month or $49.99 USD/year


SymptoThermal Rules Interpretation

Perk: I don’t know if Kindara has a monopoly on self-interpretation or what, but it’s one of the only apps to allow users to interpret and mark their own peak day and temperature shift. It also lets users mark their own coverline. This means that Kindara is good for those using a method like Taking Charge of Your Fertility (which has a higher coverline) and those using Sensiplan (which has a lower coverline). Lastly, Kindara has a very easy to read, clear chart. This is so important for users, and for those helping them.

Predictions

Kindara also does not predict fertile windows unless the user is trying to conceive (I recommend ignoring these even if trying to conceive. It is always best to do your own interpretations or ask an instructor if uncertain). It will predict menstruation based on average luteal phase length once it has enough data.

Other Features:

  • Users may share charts and get feedback from the community
  • Counts days past ovulation when shift is marked
  • Cervix Tracking (Height, Openness,Firmness)
  • Sex Tracking (Protected, Unprotected, Withdrawal, Insemination
  • OPK and Pregnancy Tests Tracking
  • Journal Available
  • Pairs with Wink Thermometer (syncs with the app via Bluetooth)
  • Emojis can be used in custom data

2. Fertility Friend

fertlity friend

Available on Android and iPhone 

Pro: Fertility Friend appears to work equally well on Android and iPhone

Cost

Pro: Free, paying is not necessary to be able to chart.

Con: VIP membership available starting at $9.99/month. This is a little expensive. The community sharing feature is only available to those who pay.

SymptoThermal Rules Interpretation

Perk: Coverline can be overridden under settings.  There are options to chart cervical mucus and temperatures.

Con: The app automatically interprets. For new users, this may be confusing. 

Predictions

Fertility Friend does predict fertile windows, period days, ovulation days, and a recommended test day for pregnancy. As always, users should rely on their own interpretations and get help from an instructor if needed.

Other Features:

  • Cervix Tracking (Height, Openness, Firmness)
  • Pregnancy and OPK tracking
  • Ton of Options for Mood, Health, Diet
  • Options for IVF, A.R.T., and Fertility Medication Tracking
  • Weight Data
  • Lightbox (With VIP compare photos of OPK and HPT tests)
  • Chart Overlay (Compare multiple cycles on one chart)
  • Sex Tracking (no option to differentiate unprotected versus protected)

3. OvuView

ovuview

Available on Android Only

Con: Pretty much the fact that it isn’t available on Apple products

Cost

Perk: Free (but with ads). One time payment of $4.99 to remove all ads. This is the cheapest app with the most features for custom tracking.

SymptoThermal Rules Interpretation

Perk: You can pick from multiple methods. Users may turn methods on and off.

Con: No self interpretation available. I have included it because unlike any other app that I have come across that interprets for users, the methods can be turned off. Users may play around with the methods to see if they can mark their chart according to their method’s rules. Turning off all settings would leave a chart for the user to interpret themselves even though they can’t self-mark.  Another con is that the temperature scale is very hard to read. Make sure to round or drop your temps. Ovuview may not always do this correctly.

Predictions

Ovuview predicts future fertile windows, ovulation days, and periods. Users should ignore this in favor of self-interpretation.

Other Features:

  • A ton of custom tracking like medications, moods, weight, etc.
  • Syncs with the Tempdrop device (This is wearable BBT. My review is coming soon. Full disclosure: this link earns me ten dollars if you use it to purchase the device)
  • Cool design. Users can choose their own chart colors, background, custom data colors, etc.
  • Cervix Tracking (Position, Opening, Texture)
  • OPK and Pregnancy Test Tracking
  • Fertility Monitor Tracking (None, Low, High, Peak)
  • Sex Tracking

Conclusion

There are limited options for self-interpretation when it comes to FAM apps. The three apps above are the best I’ve found when it comes to self-marking.

Look out for my next blog on how to chart using Google Sheets. I’ll be creating a Youtube video on how to do this yourself. This method of charting allows self-interpretation, custom data tracking, and users can chart on their computer or phone.

Google Sheets

chart 19

chart192