
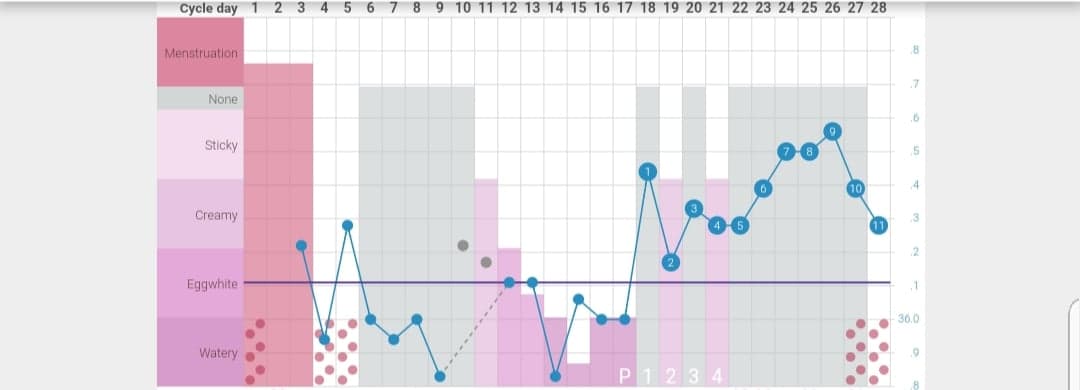
Have you ever wanted to know what it is like to chart with the Billings Ovulation Method? This blog attempts to give an overview of what it is like for one individual to chart with the Billings Ovulation Method (BOM) over a single cycle. I go through each day of the cycle and explain my overall charting habits. All times are just approximate. I get personal and discuss some challenges I experience with natural family planning. BOM involves tracking sensation felt at the vulva along with the visible appearance of cervical mucus as a person goes about their day to day activities.
Day 1: Record heavy bleeding. Heavy bleeding feels wet. Done! Users are not allowed to use heavier days in the Billings method when avoiding pregnancy. This is a true day one of a cycle because it was preceded by a Billings peak day.

Day 2: Record heavy bleeding. Heavy bleeding feels wet. Done!

Day 3. Record medium bleeding. Medium bleeding feels wet. Done!

Day 4: Very light bleeding. It is now possible to observe my basic infertile pattern of dry.
8am: I feel dry and see a small amount of blood.
10am: I still feel dry.
8pm: I still feel dry. I see no mucus. Sex is allowed in the evening of this day. We use this day.

Day 5: Extremely light bleeding. Technically this day is not allowed for intercourse since I used the day before and Billings method rotates alternative evenings. We use this day anyway #rulebreaker

Day 6: I feel dry. I do not see anything. I record this day as “possibly fertile” since I broke a rule and used the day before. Every day after intercourse gets this white stamp in the pre-ovulatory time of the cycle.

Day 7: My basic infertile pattern of dry is still there! I notice nothing the entire day in the bathroom and my vulva sensation is dry. Sex is allowed in the evening. I consider my evening 8pm because I go to bed around 9pm on average. We use this day.

Day 8: I feel dry all day and see nothing. However, this day is not allowed since Billings alternates days. We skip this day.

Day 9: I feel dry all day and see nothing. However, we do not use this available day because we are both tired. It happens!

Day 10:
9am: I feel a bit moist. I don’t see anything when wiping in the bathroom.
11am: Still feel moist. I do not see anything in the bathroom.
2pm: Still feel moist. I do not see anything.
4pm: Still moist. Nothing seen.
4:45pm: Walking to my car from work. Still moist!
8pm: Overall observation for the day is moist. I record it. The fertile window has opened. This is known as the point of change.

Day 11:
7am: I feel moist as soon as I walk to the bathroom. I see very scant clear mucus on the tissue.
I do not see or feel anything for the rest of the day.
8pm: Overall observation for the day is “moist, clear”

Day 12:
7am: I feel moist, but see nothing.
10am: I feel moist, but see something white.
8pm: The feeling remains the rest of the day. I record “moist, white” for the day.

Day 13:
7am: I feel dry.
11am: I still feel dry.
1pm: I feel wet sensation when walking to my office. This is a change, so I keep that in mind.
I feel damp the rest of the day. I never see anything in the bathroom. I record “wet” as the most fertile sensation that day.

Day 14:
6:30am: I immediately feel moist.
9am: I see long clear strings when wiping in the bathroom.
11am: I have a wet sensation when walking around.
3pm: I walk around my work place. I still feel moist.
5pm: I see clear strings again.
8pm: I record “wet, clear strings” on my chart.

Day 15:
7am: I feel a gush as soon as I wake up. I do not see anything in the bathroom.
9am: I see scant, clear mucus on the tissue when wiping.
11am: I feel very wet walking around my work place.
1pm: I do not see anything on the tissue.
3pm: I do not see anything on the tissue.
5pm: I feel wet sensation while making dinner.
8pm: I record “wet, clear” as my observation for the day.

Day 16:
7am: I do not feel or see anything when waking up.
9am: I still do not feel or see anything.
12pm: I go for a 20 minute walk. When I get back, I feel slippery sensation. I go to the bathroom and see copious amounts of long, clear mucus.
8pm: I felt slippery the rest of the day. I record “slippery, long clear” on the chart.

Day 17:
6am: I feel dry when waking up.
8am: I don’t see anything or feel anything.
11am: I don’t see anything or feel anything.
8pm: The day was nothing felt, nothing seen all day. I record dry. This means yesterday was my peak day because it was a changing and developing pattern ending in slippery followed by an abrupt dry up to no longer wet or slippery.

Day 18 and Day 19:
I have the same experience as day 17. I pay attention all day and observe no mucus or sensation.


Day 20:
Ovulation is expected to be over and the cervical mucus plug has re-closed for the cycle. Sex is available any time for the rest of the cycle until day one of menstruation occurs. I can chart, but it is not necessary to wait until the evening and observations are less important as sex may interfere at any time.

Day 28: I record heavy bleeding and the rules restart.

Real Talk: Diffulties / Obstacles With Billings Not Seen on the Chart
These are things that I find can be difficul in my own personal experience. I know that people in really long cycles or with other irregularities may have different issues than me.
Challenge One: Alternative evenings only can be a struggle, and it seems even harder for me right before the fertile window opens due to my mood at this time of the cycle. This follicular phase is much longer for me than my luteal phase on average, and this means alternative evenings is the rule for most of my cycle. If someone has a partner with a conflicting schedule, this can especially be offputting. I think anyone who is going to practice this method should consider whether this is practical for their lifestyle.
Challenge Two: Expected abstinence in Billings can be hard, and I have fairly short fertile windows on average. I originally practiced sympto-thermal, and I switched to Billings when I realized that overall consecutive abstinence was much less overall (for my own cycle, Billings: 9 days, Sympto-Thermal: 14+ days). I tend to break some rules still, but this is much more suitable for my fertility intentions level than sympto-thermal.
Look out for my next blog on “A Day in the Life of a Marquette User.”
Disclaimer: Do not try to learn how to chart from this post. Everyone has their own unique cycle and this is just an example of charting with Billings in a regular cycle. Please reach out to me if you would like to learn this method with me as your guide. Alternatively, you can find a teacher here.


You must be logged in to post a comment.