An Honest Review of Fitbit for Menstrual Cycle Tracking

You may know that the Fitbit app has some built in menstrual cycle tracking features, but many people do not know that it has other features that may be useful for menstrual cycle tracking. In this article, I will review the pros and cons of the Fitbit app as it relates to cycle tracking for people who ovulate. For context, I use a Fitbit Charge III.

The most basic feature that Fitbit offers for cycle tracking is recording bleeding dates of menstruation and then displaying a predicted fertile window based on average cycle length.

The pink bar represents the length of menstruation. The blue bar represents a predicted fertile window. The flower symbol represents predicted ovulation.

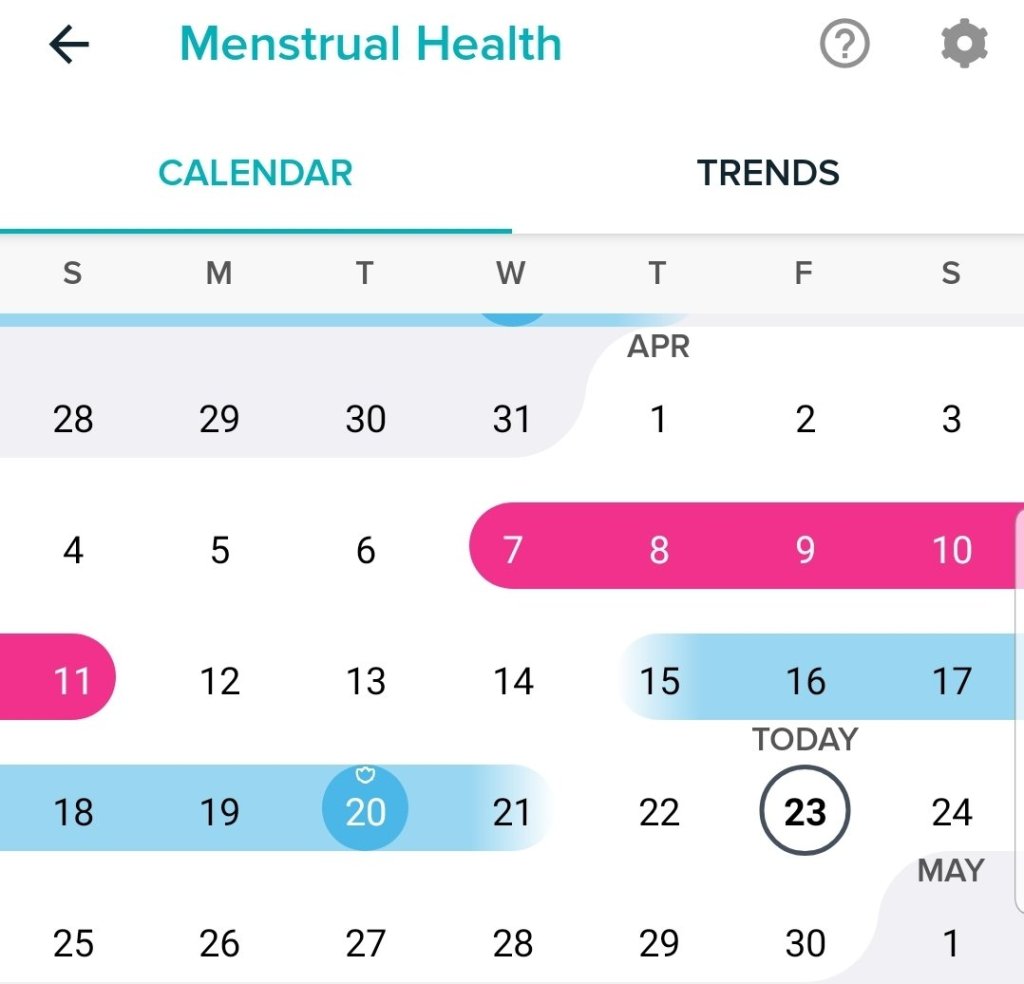
The user needs to remember to input menstuation each cycle. Once it is inputted, Fitbit will generate the blue fertile window. This fertile window should NOT be used for avoiding pregnancy, as it is only based on cycle length and not real-time fertility signs like cervical mucus or basal body temperature.

Once menstruation is entered, it will also begin a countdown until your next predicted menstrual cycle.

Countdown until menstruation in the app.

Unfortunately, I do not find this basic feature very useful for anyone who has any cycle variation. Even though my cycle length has increased over the last year, Fitbit has not automatically updated my cycle lengths. The app does not appear to be very adaptive without user input.

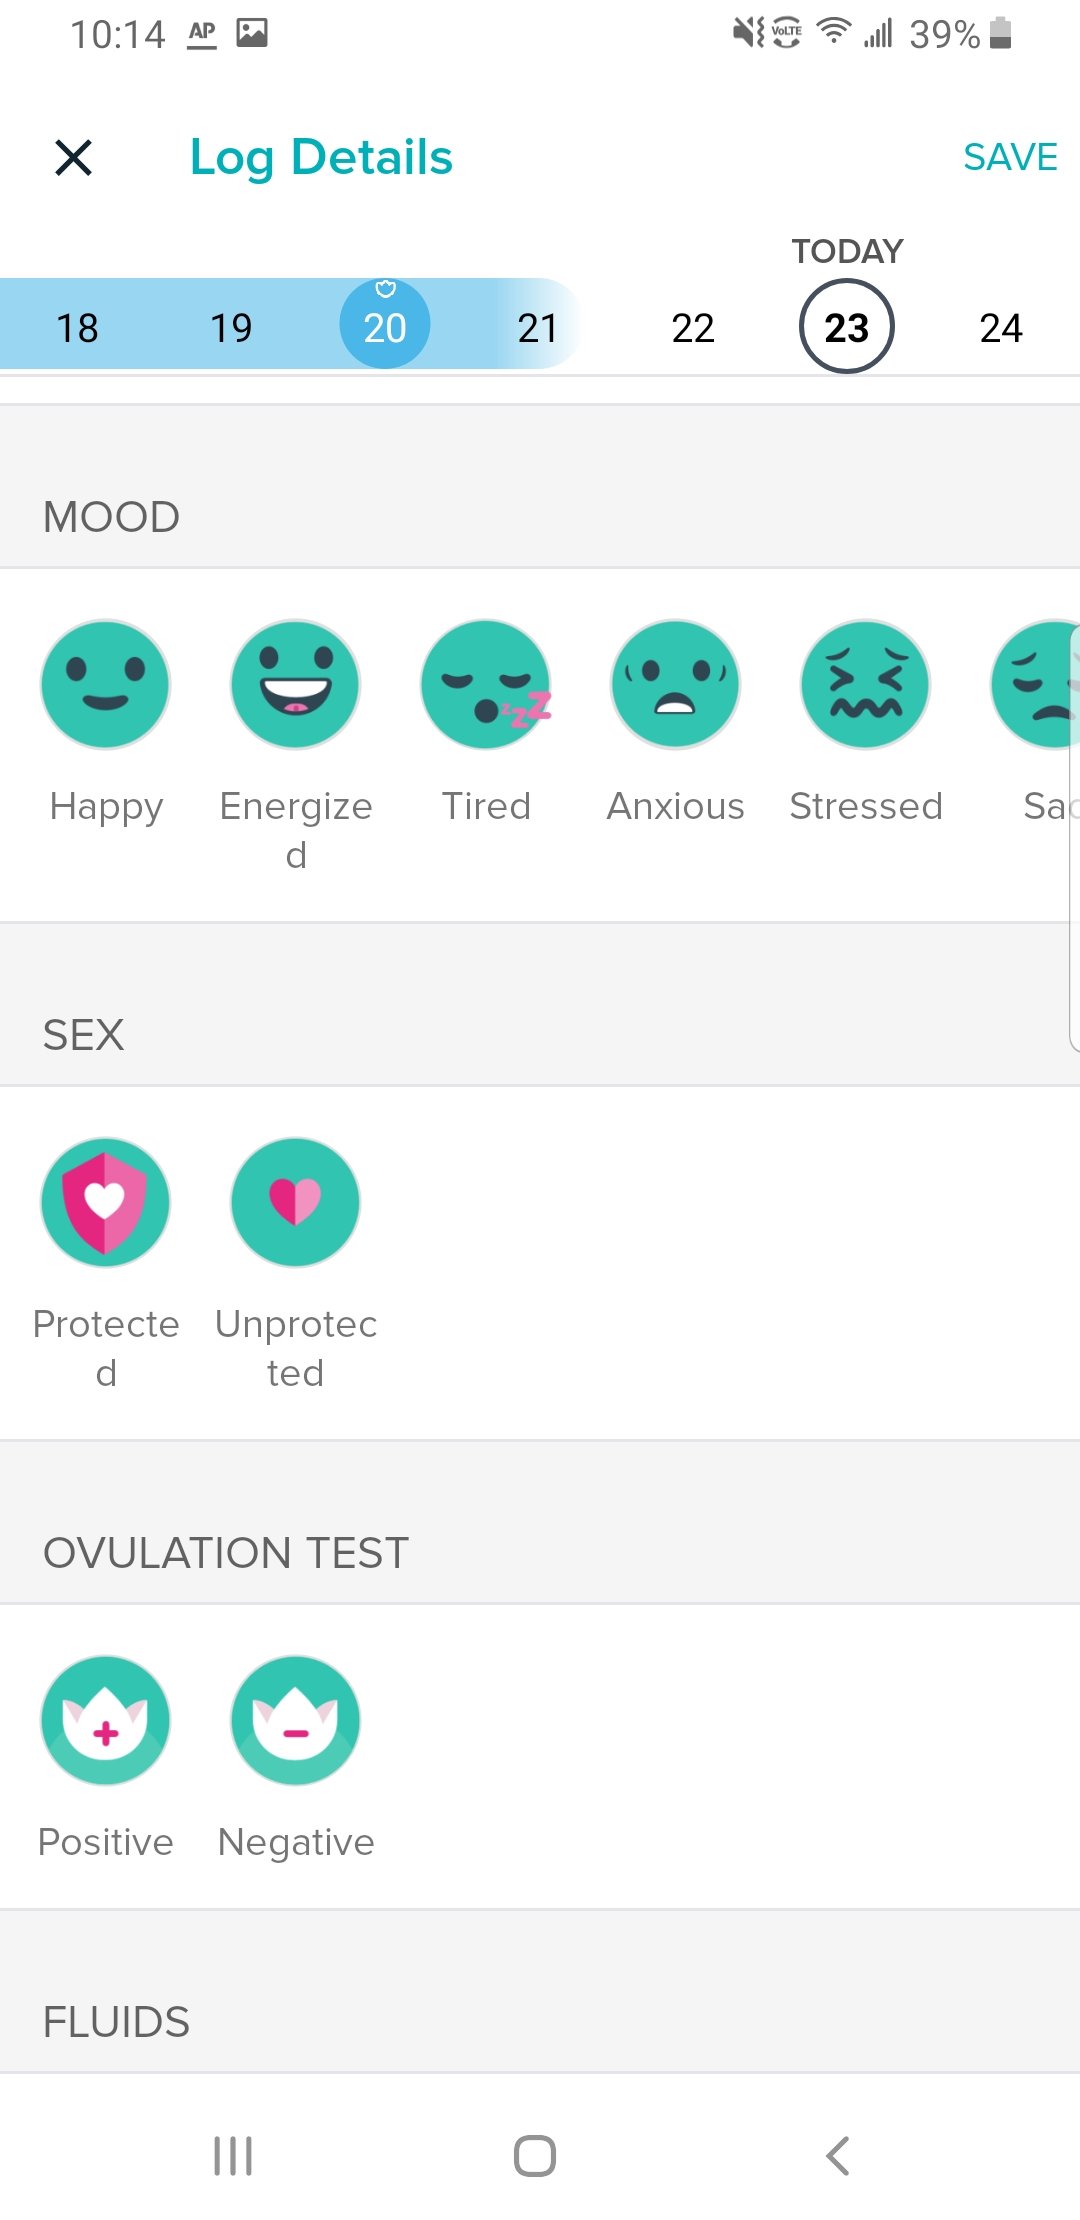
In addition to tracking bleeding the app offers options for:

  • Mood
  • Plan B (morning after)
  • Ovulation tests (better called luteinizing hormone tests)
  • Cervical mucus (Taking Charge of Your Fertility categories)
  • Cyclical symptoms like acne

It is rather disappointing that the app does not include options to mark pregnancy when it occurs, especially since we know that this changes daily calories burned and heart rate, to name just two effected areas of the app.

A really cool feature that I do like is the ability to show cycle trends like flow intensity and cramps. The same screen that displays this will also let you scroll through all past cycle lengths.

In the settings of this screen, you can also decide to toggle off predictions. For people avoiding pregnancy, I do recommend either ignoring or toggling off predictions in the Fitbit app. The app allows you to choose your current birth control method as well.

Outside of the designed menstrual cycle tracking features, I want to highlight resting heart rate as a potential exciting thing to track for those who are not taking hormonal contraception. Why do you need to not be taking hormonal contraception to utilize the heart rate feature for menstrual cycle tracking? Hormonal contraception suppresses ovulation, and ovulation changes our heart rate charts!

To learn more about resting heart rate and the menstrual cycle, read my previous post here.

You can see my heart rate falling during menstruation around April 10th, and then rise during my fertile window and luteal phase.
Menstruation began when my heart rate dipped below 70 on this chart. Ovulation likely occured around the third raised heart rate in this close-up.

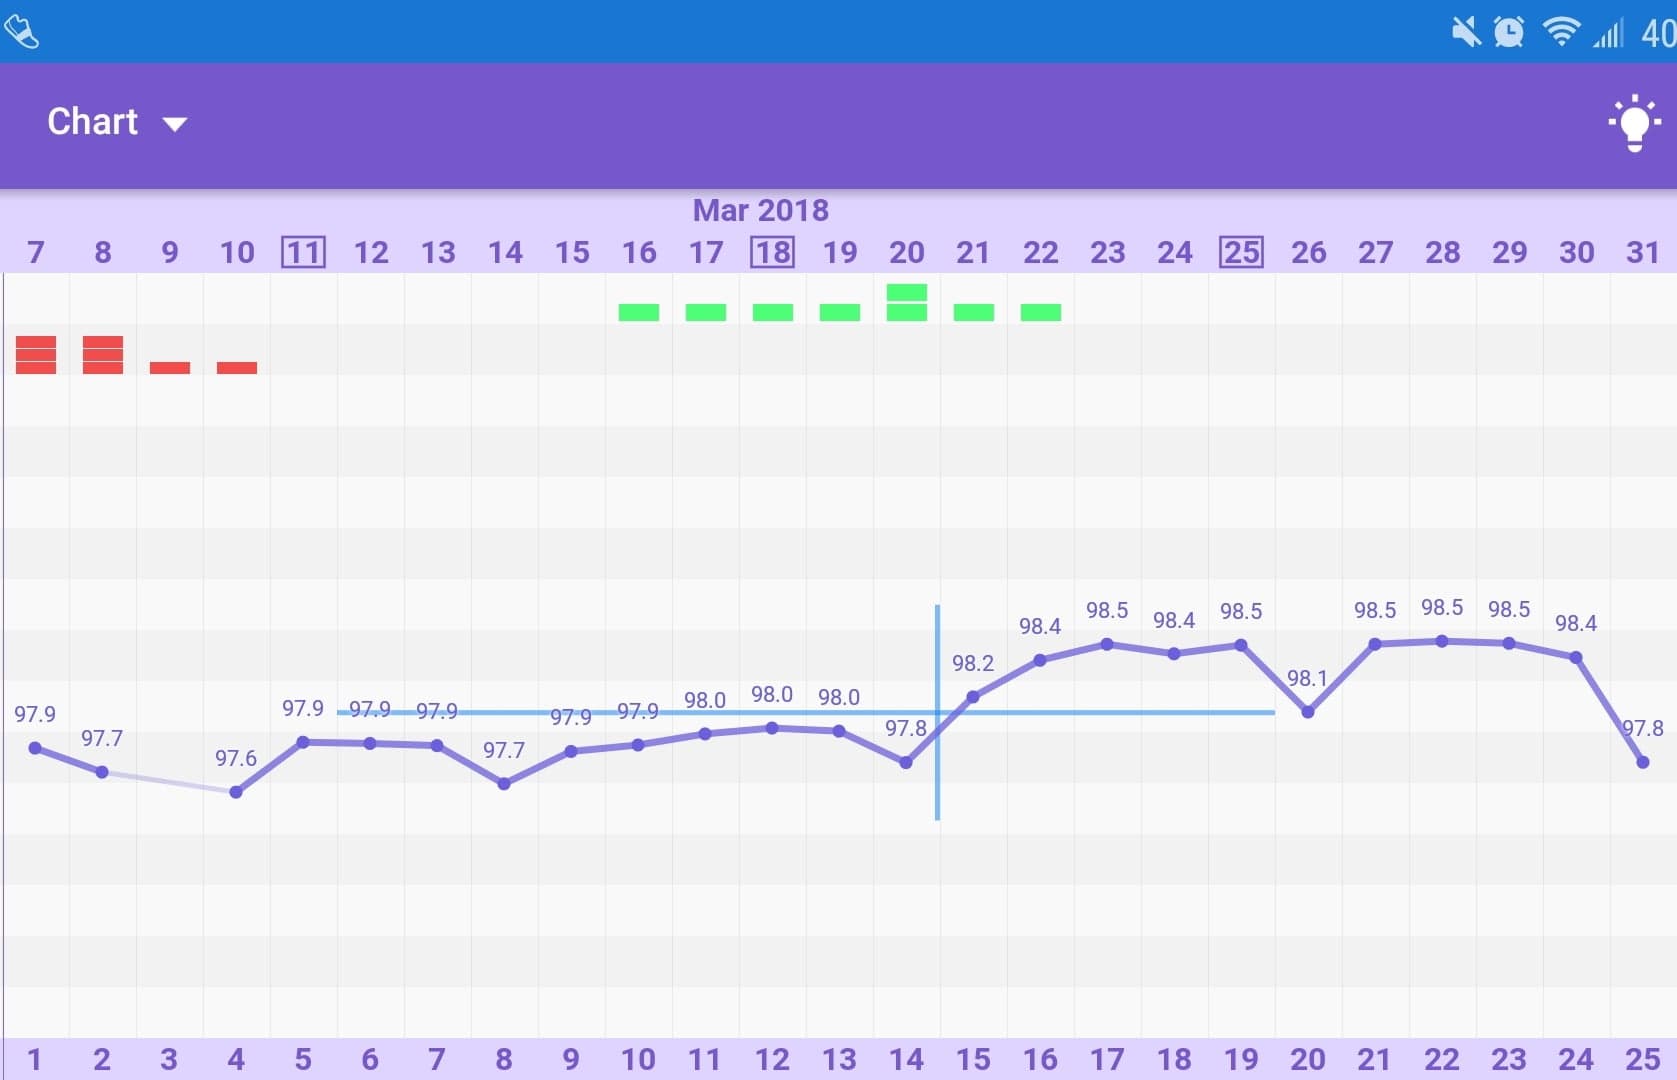
Heart rate in people who are ovulating is at its lowest point during menstruation, rises during the fertile window, and continues to be elevated in the luteal phase.

When heart rate begins to drop again, this is an excellent way to predict menstruation will soon occur. For example, I have been tracking my heart rate in Fitbit for 2 years, and I always bleed when my heart rate dips back down to 70 beats per minute after my luteal phase!

I do think this feature is worth tracking for anyone interested in a more precise period prediction than cycle length. If you have Fitbit premium, you can also find a setting for sleeping heart rate under restoration. This may be more steady than resting heart rate for some individuals.

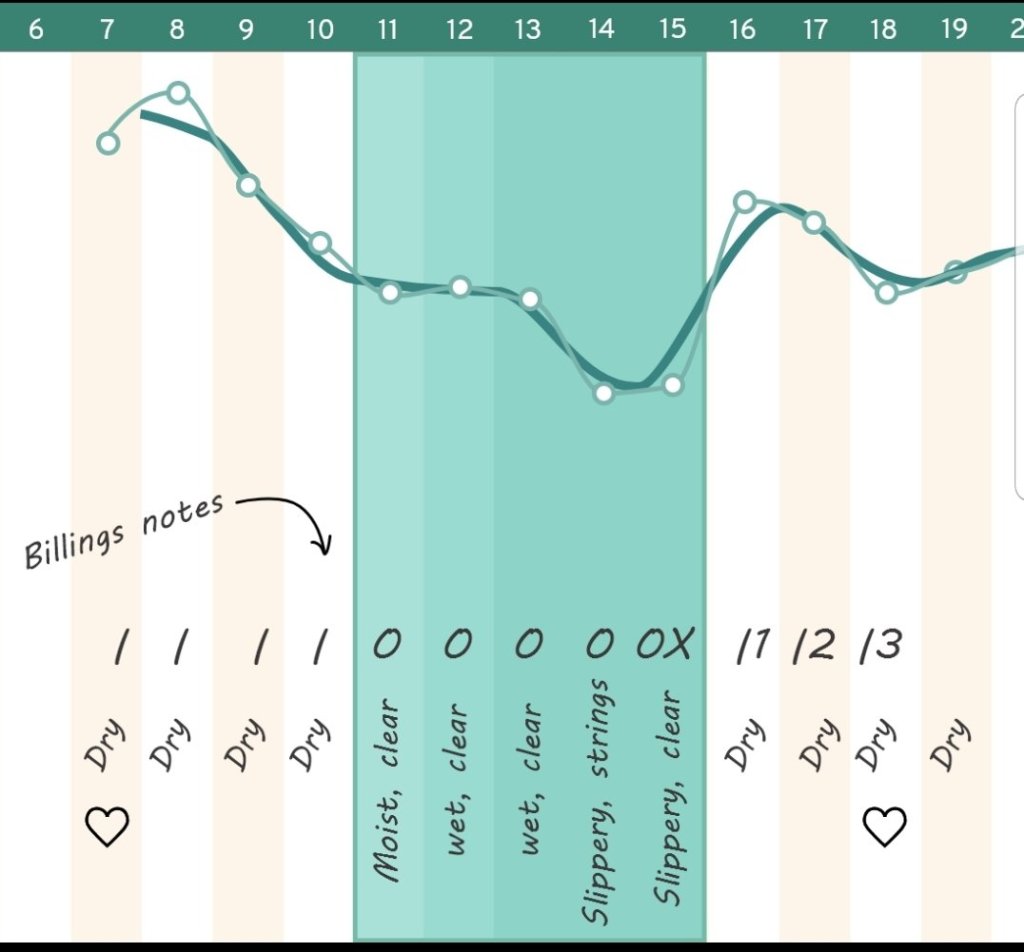
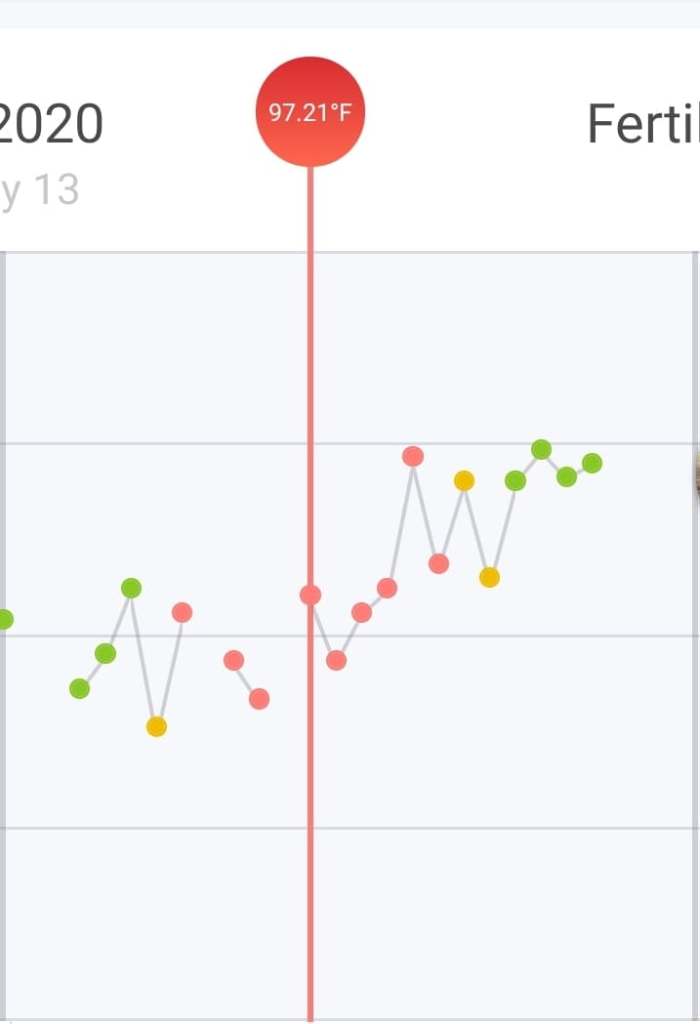
Lastly, I want to address Fitbit temperature for menstrual cycle tracking. Unfortunately, wrist temperatures are not a compatible parameter for fertility awareness when it comes to avoiding or achieving pregnancy. It can be incredibly erratic. When we track temperature, we want the temperature as closest to the core as possible.

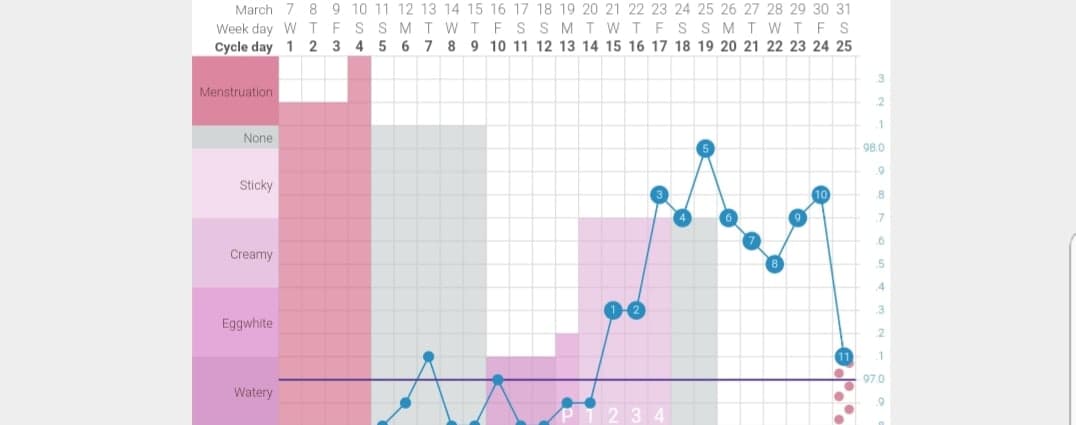
Fitbit does not give precise temperatures, instead it gives deviations from a range. I likely ovulated near 18, 19, or 20 on the photo above. While Fitbit did detect a slight shift, it is not particularly clear, and it dropped back down.

As depicted above, my luteal phase the previous month was extremely undefined, and I could not determine a confirmed temperature shift with it.

For now, I do not recommend Fitbit for precise temperature tracking. Instead, I recommend a basal body thermometer.

Conclusion

Fitbit offers some really unique options for cycle tracking, but it should not replace your birth control or fertility awareness method. The heart rate feature may be useful for identifying cycle phases, but the temperature readings are not suitable for tracking cycle phases.

An Honest Review of Kegg

The kegg device draws a fertile window to give you the best days for conceiving a pregnancy based on the electrolyte levels present in the vagina. To use this device, someone would insert kegg into the vagina in the same two hour period of time during the day. kegg takes approximately two minutes to give the user a reading on the graph. As a bonus, it also gives you the opportunity to do kegel exercises while using it. Click here to read an article on the science behind kegg.

This product is an exciting development in the femtech field because it actually does read a real-time fertility sign. Cervical mucus is completely necessary for natural conception to occur. Without the presence of cervical mucus in the cervical crypts, sperm cannot to get to their destination to reach the egg. For this reason, anyone trying to conceive needs to track cervical mucus or use an alternative device such as Kegg (or a device that reads estrogen levels) in order to time intercourse for when they are most likely to conceive.

Here’s what Kegg looks like!
My kegg values compared to my Billings Ovulation Method cervical mucus observations. I believe that the kegg was highly correlated with my actual fertile window based on a traditional fertility awareness based method!

Who is Kegg right for?

It is important to know that kegg is not suitable for avoiding pregnancy. It is designed to find the most suitable days for conception. For those avoiding pregnancy, the fertile window has to be much longer than the window what the kegg gives. Until kegg has been studied for pregnancy avoidance, I cannot recommend it as an alternative to cervical mucus checks which must be made multiple times of day until the evening when someone is strictly avoiding pregnancy.

kegg may be right for someone who wants to conceive without needing to take a class or read a book on cervical mucus. In my experience, for the most part, it detected my most fertile days in a way that would likely lead to conception if used.

kegg may not be right for you if you have a very erratic schedule. Because it has to be used in the same two hours and cannot be used up to 8 hours after sex, this may make Kegg harder to use.

Click here to purchase your kegg!

Customer service with kegg has been excellent. The team is very reachable. If you would like to see more kegg charts and learn from fellow keggsters, you may join the kegg facebook group for conception or for those using it along with other fertility signs to avoid.

One Cycle Seven Ways: Experimenting with Marquette (Clearblue Monitor), Billings Method, Sympto-Thermal, Daysy, Kegg, DOT, and more!

Over the last several months, I have been testing multiple femtech products (such as Daysy Fertility Tracker, Kegg, DOT) and comparing them to charting methods like Marquette, Billings Ovulation Method, and Sympto-Thermal (NFPTA). These products and methods rely on different fertility signs such as basal body temperature, cervical mucus, urinary hormones, electrolyte levels, and calendar dates.

Disclaimer: Do not attempt to learn to chart using this post. My own experience may not reflect your unique cycles. My fertility intentions may not be your intentions.

Keep in mind that different methods may change safe days over time. The following data is only a snap shot of what fertility windows for avoiding pregnancy could look like. In particular, the Daysy thermometer only has 4 cycles of data on me.

Expected Consecutive Abstinence Over 3 Cycles

Cycle 52

  • Billings Ovulation Method: 15 (9 consecutive)
  • Marquette: 13
  • Sympto-thermal: 16
  • DOT: 12
  • Daysy: 15

Cycle 53

  • Billings Ovulation Method: 14 (8 consecutive)
  • Marquette: 13
  • Sympto-thermal: 13
  • DOT: 12
  • Daysy: 14

Cycle 54

  • Billings Ovulation Method: 16 (9 consecutive)
  • Marquette: 15
  • Sympto-thermal: 19
  • DOT: 12 (EXTREMELY RISKY)
  • Daysy: 15

From this data, you can see that sometimes the amount of expected abstinence does not differ from method to method, and sometimes it differs a whole lot! On my last cycle with DOT, it ended my avoidance window on the day after peak fertility occured. Fertility is still potentially high on the 3 days following this date.

Billings method almost always had the least consecutive abstinence because it relies on real-time fertility signs to open the window. However, because it rejects calculation rules and relies on one primary sign, only alternative evenings are ever allowed for pre-ovulatory sex. In addition, heavy days of menstruation are not allowed due to the possibility of early ovulation, and the bleeding obscuring the opening of the fertile window.

Other methods like Daysy, Sympto-thermal, DOT, and Marquette do allow pre-ovulatory consecutive sex, but most of that falls during menstruation for my cycle ranges (25 to 30 days).

Whatever method works best for someone is very dependent on their lifestyle and what someone is willing to diligently track.

The Same Chart Seven Ways

The highlighted days represent days to not use in order to avoid pregnancy with these methods.

My hearts are left on to show the fertile window and for authenticity. Do not use these charts to try to learn the rules of any method or to determine when sex is safe. You will see some broken rules based on my own personal intention level and on the fact that not all fertility signs will show the same window.

The Billings Ovulation Method draws the fertile window based on vulva sensation and cervical mucus. Any heavy bleeding is considered potentially fertile because it obscures readings and ovulation can always happen early. It requires alternating evenings for sex during the established basic infertile pattern.
This is the Marquette Method while using only urinary hormones and calculation rules. Fertile window opening determined by calculation rule based on last 6 cycles or first “H” reading on the Clearblue monitor. Clearblue measures estrogen and luteinizing hormone. My first window is also closed by a progesterone test in addition to meeting PPHLL rules.
This is the double-check sympto-thermal method per Natural Family Planning Teachers Association (NFPTA) rules. It opens the fertile window based on the shortest cycle in the last year minus 20. It closes the fertile window based on cervical mucus and basal body temperature.
This is a chart with the Daysy Fertility Tracker. This basal body thermometer learns your patterns over time and opens the fertile window based on past cycle data. The fertile window changes with time, and this is technically my 3rd Daysy cycle. Caution days and Red X days are for avoiding intercourse. Daysy does not allow the user to mark temperatures questionable, but I have marked two days questionable because I drank alcohol or had the heater on.
This example chart includes my cervical mucus notes for more context. DOT is a calendar based method that looks at the last 12 cycles of data. Only people in regular cycles can use DOT. Black moons are days available for intercourse based on the calendar method. In the next line, I also have included Kegg. Kegg predicts ovulation for trying to conceive purposes only, so I am including it as a bonus comparison. By reading the electrolyte levels in my cervical mucus, it determined that these 3 days were the most fertile days of the cycle. A full Kegg review is forthcoming in December 2020.
This is a resting heart rate chart. Resting heart rate has been shown to correlate with the menstrual cycle. I convert my heart rate like this: 69 = 96.9, 70 =97.0, 71 = 97.1, etc to be able to fit it onto the graph. You can see that it very closely followed my ovulatory pattern.
Here is my chart with all the data in one. It is so cool how different fertility signs draw the fertile window!

Unfortunately, my Mira Fertility sticks were flawed, so I had to remove that data from this experiment. In the future, I will do a comparison post also using this device. I am currently still testing the Kegg device, and a review with full Kegg charts is forthcoming in December. Kegg cannot be converted to display on the Read Your Body app, so I could only include the fertile days in this post.

Do you have any questions about all of these methods?

Consider coming to my free Instagram Live on femtech on November 28th. You can find me @chartyourfertility.

On December 12th, I’m offering a “pay what you can” introduction session that is minimum $5 to $30 USD on regular FABM methods and what the main differences are. Reach out to me if you would like to come.

Finally, a special shout to the Body Literacy Collective and the Read Your Body app for making this post possible by creating the most versatile charting app on the market!

Why You Should Be Cautious About Calendar-Based Methods (Daysy, Natural Cycles, DOT)

Calendar methods get a really bad rap in the fertility awareness communities. A lot of this is for a very good reason. When the calendar rhythm method was discovered in the 1930s, it was revolutionary. However, since then, we have discovered real-time fertility signs such as cervical mucus, basal body temperature, and urinary testing.

To illustrate why calendar-based rules can be both risky and occasionally line up with real-time signs, I charted with three calendar-based methods for opening the fertile window versus a method with real-time fertility signs only (specifically I used the Billings Ovulation method for my real-time method).

In the first line, you will see the Natural Cycles method. This method relies on basal body temperature as its only required real-time sign. Unfortunately, basal body temperature can only tell you when your fertile window closes, not when it opens. Temperature has no predictive qualities for letting you know if you are going to ovulate at a different time than normal.**

With only 3 cycles of my previous data, Natural Cycles gave me until day 8 as safe for this cycle. What Natural Cycles doesn’t know is that my cycles range from 24 to 30 days long over a calendar year. For this reason, it can be quite risky some cycles for me to be allowed safe sex until day 8. The fact that this cycle happened to line up is merely a coincidence! This coincidence can cause a confirmation bias when people use this app and do not get pregnant. If you are seriously avoiding, be wary of any method that doesn’t allow you to crosscheck the opening of your fertile window.

Natural Cycle also closed my fertile window in an incredibly risky manner. It told me I was safe on the morning after my real-time sign of “peak” day. In fertility awareness based methods, “peak” is the highest level of fertility you can get in a cycle. The two days following Peak day also have a significant chance of ovulation occurring. Every time I have used Natural Cycles (here is my previous try with it last year), it gives me a very risky closing to the fertile window.

Here is my full chart from Natural Cycles this time:

Natural Cycles app

Next up on the chart above illustrating my safe days is the Daysy thermometer. Daysy is a thermometer that relies on calendar based rules and potentially earliest temperature shift based rules to open the fertile window. In my two experiences with Daysy, it has been much more conservative than Natural Cycles. Daysy does learn over time, so it is possible I could have a risky day with it in the future, but so far I have not had any risky days with Daysy.

You can see in the image above that Daysy confirmed ovulation last out of all of the methods. I believe this is because my temperature shift was a bit erratic and because the device does not allow the user to mark temperatures questionable (I had two that were marked questionable for my own manual interpretation).

Daysy does not rely on anything except cycle length and temperature shift timing to open the fertile window. For this reason, Daysy can be risky if you ever have a very early ovulation. It can also be risky if the user is not careful about only taking their temperature when it is not disturbed, or if the device misreads a temperature shift. In my experience, Daysy tends to be much more cautious than Natural Cycles.

Daysy Chart

My third line is a true calendar only method. DOT has over a year of my data; however, the prediction has only given me one extra safe day during my whole use of the app. DOT is entirely based on the calendar method. However, interestingly DOT got higher efficacy than Natural Cycles in their study. Here is my DOT chart below

While I do not recommend the calendar method to most charters, this app can be useful for period prediction or for birth control if you are okay with an unintended pregnancy if you were to suddenly have a longer or shorter cycle. Users for DOT must have no more than 8 days variation in their cycle per calendar year.

In the example above, DOT actually gave me no risky days whatsoever. Again, this is a coincidence that it seemingly lined up with other signs. At any time, cycles can always change.

DOT the app

Finally, my main method is the Billings Ovulation Method. Billings relies only on real-time fertility signs. This means that they reject any calendar-based thinking, including the idea that menstruation is automatically safe. My Billings chart was based on when cervical mucus opened the fertile window (cervical mucus is what helps sperm survive) and when cervical mucus peak rules closed the window (when sperm can no longer access the cervix because ovulation is over and the cervical mucus plug has closed).

I always recommend real-time fertility signs to anyone who wants very high efficacy, the least amount of consecutive abstinence, who may be in regular or irregular cycles, and who want to understand their body and their health on a more deeper level. Here is an example of a Billings method chart. The babies represent possibly fertile days.

Conclusion:

I hope this post helps you think critically about whether calendar-based methods for opening the fertile window are right for you!

Here is a breakdown of efficacy for these methods:

Daysy: Claims 99.4% perfect use, but their study was retracted.

Natural Cycles: 98% perfect use, 93% typical use.

DOT app: 99% perfect use, 95% typical use.

Billings Method: 97.8 to 100% perfect use, typical use varies depending on country.

**Some modern fertility awareness methods use the Doering Rule to set the opening of the fertile window. This can be very safe and yield high efficacy. Doering is based on the earliest temperature shift of all time (not just the last year).

An Honest Review of Proov PdG Tests

Are you interested in testing your progesterone at home with Proov?

If you decide to purchase, use promocode: CHARTYOURFERTILITY for 30% off the original PdG tests or Proov and Confirm.

Proov tests check levels of the hormone metabolite PdG in the urine. Proov tests are an FDA approved product. People who are ovulating produce the hormone progesterone after ovulation. If you are a fertility awareness charter, you can use these tests to double check that ovulation has occurred along with your other fertility signs. If you are seeking to become pregnant, you can use these tests to help see if your luteal phase is sufficient to support a pregnancy.

Here are a few links on recent studies so that you can be more informed about using this product:

Proov is Clinically Validated

Study on Urinary Hormones and Progesterone

Study on Proov Combined with Fertility Awareness Methods

Study on Combining Proov with Clearblue

I have personally been using Proov since 2019. I can highly recommend this product. Proov has excellent customer service and is continually trying to improve their services and expand product options.

My most common day to get my first positive Proov is approximately 3 to 5 days after a positive LH test. I love having Proov as a crosscheck so that I can have an extra way to confirm ovulation. I like having a ton of data in my fertility awareness routine.

For those trying to conceive, the tests can be used around 7 to 10 days post ovulation (counting from positive LH test). If the tests are positive, this is a good sign that your progesterone is high enough when implantation is most likely to occur on days 7 to 10 post positive LH test.

I used it 7 to 10 days past my first positive LH test to see if my progesterone levels were high enough in the last part of my cycle. Ideally, for conception purposes, you want to see positive Proov tests on days 7 through 10.

These tests are also useful for people with irregular cycles or tough cervical mucus patterns because they can help you know if you have indeed ovulated.

The Proov Insight app can help you read your tests, including PdG, LH tests and the new Multihormone test! It recently updated to include numeric values. This makes the data even more meaningful! Some people struggle reading Proov, and the app is definitely useful for those people.

The app will give you an “ovulation score” based on whether your tests are positive during the days most likely for implantation. This ovulation score can help you plan to improve your health if you notice low PdG levels.

It’s me!
My ovulation score!
PdG levels in the app

I highly recommend trying Proov if you are curious about your progesterone! For now, I have decided to make Proov a permanent part of my fertility awareness routine.

Use promocode CHARTYOURFERTILITY for 30%!

Cool Femtech that You Can Use (With FAM) to Avoid or Achieve Pregnancy

As you probably know if you have read any of my previous critiques of femtech, I am often wary of it. However, there are some devices and tools that I can 100% get behind because they allow user interpretation or are a part of a fertility awareness based method. The following list is of devices that can be used with a fertility awareness based method to avoid or achieve pregnancy.

The Tempdrop Thermometer is a wearable BBT that you can use to get accurate temperatures no matter your amount of wake times during the night. This is super useful for postpartum women or those who have irregular sleep times!

Click here to read my Tempdrop Review and use my referral link to get 10% off the two top tier options.

Proov Test Strips are used to determine if your progesterone levels are high enough to sustain pregnancy and as an extra way to confirm ovulation for those avoiding pregnancy. I have personally used these as an extra layer of ovulation confirmation. Use PROMOCODE: CHARTYOURFERTILITY for 30% off Proov.

Order them here: Proov Test.

An Honest Review of Tempdrop

Are you looking to simplify your basal body temperature charting routine? Is getting up in the morning just too hard to remember to take your temperature? Read on!

There are currently a few wearable basal body thermometers on the market such as iFertracker, Ava, and Tempdrop. In this blog, I will review the Tempdrop device. If you decide to purchase, use this link and get 10% off the device. This discount only works on the Confidence and Freedom Packages.

tempdrop

Tempdrop is a wearable basal body temperature thermometer that came onto the market in 2017. Rather than setting an alarm, you can simply put this thermometer on before bed. You wear it around your upper arm (and it may be worn in a bra as well). It needs 3 hours of sleep to determine your basal body temperature. The device uses an algorithm to find your true temperature, regardless of how many times you have gotten up or whether you had restless sleep this night.

This device is very popular with shift workers, breastfeeding mothers, and other people who don’t get a regular amount of sleep and wake up at different times. It holds 24 hours of data, and it must be synced at least every 24 hours or you will lose previous data. After wearing it for 15 days (as of March 2020), the algorithm will kick in. (If possible you should back up temp with oral basal body temperature for the first 60 days if you are avoiding pregnancy. If not, use a different method of protection). By day 60, the device will only change and make improvements to the last 2 temperatures taken.

PROS

  1. Helps Women Practice the Sympto-Thermal Method: If you are not able to take your temperature with a normal basal body thermometer due to breastfeeding, shift work, or other irregular sleep schedules, this device will help you practice any sympto-thermal method of fertility awareness or natural family planning. 
  2. Great Customer Service: I have had to interact with Tempdrop Customer Service several times. They are fairly prompt with responses, and they do try their best to troubleshoot with you. While there was an issue with the Tempdrop frame breaking, they fixed this issue for free.
  3. No Alarm Needed: Hate your alarm? You won’t need to set it to take your temperature if you wear Tempdrop. This is a big game changer for people with irregular sleep schedules. It can make your mornings much easier. 
  4. Helpful Facebook Group: You may join the Tempdrop Facebook group for support and charting help. They have detailed units about how to use this device to achieve or avoid pregnancy. There are multiple spin-off Tempdrop groups that you may want to explore as well.

CONS

  1. Price: Tempdrop Basic Package is $159 (12 month warranty). Tempdrop Confidence Package is $199 (12 month refund guarantee, 24 month warranty, Tempdrop Care available). Tempdrop Freedom Package is $249 (24 month warranty, Tempdrop Care, 12 month refund guarantee, extra armband and battery). While this price could be worth it for you if it’s the only way you can take your temperature, it may not be affordable to everyone. This price is still a little high, especially if you are making minimum wage or have other expenses like childcare. The referral codes only work with the higher price packages (scroll to the end of this to get 10% off the device). If you have kids or animals, you may want to get a better package if you believe your device may be damaged easily.
  2. Battery: The device does not tell you when the battery is dying. However, you can contact support to find out. They now recommend changing the battery at 8 months.
  3. Frame Breaking: Many people (myself included) have had the frame break easily. However, the company promises that they are trying to fix this issue and a newer frame with different plastic will be issued with devices bought this year.
  4. Changing Temperatures: If you are the anxious type, you may not like the last few temperatures changing. While this is due to the way the device functions, some people may find it unsettling. Second, many people who chart expect that they will see a drop in their temperature before they get their period or the day of. I personally never got the drop to indicate my period was coming until Tempdrop retroactively adjusted my last temperature. With oral basal body temperature, changing temperatures is not a problem.

In 2020, Tempdrop released their own app. I do NOT recommend using it to interpret your data for you. It is quite expensive, and it does offers to interpret your data for you. The best app is one that lets you make all the decisions instead of forcing you into certain rules that may not fit your chosen method.

Here is an example of the Tempdrop app:

Screenshot Image

Source: Google Play Store

Instead, I recommend using Read Your Body app which is only $15 USD a year and empowers you to read your own fertility signs! It automatically syncs with Tempdrop. This is my top recommendation if you are determined to use Tempdrop for avoiding pregnancy. It is entirely customizable down to the cervical mucus categories and incredibly diverse custom data. See my blog on using this app for 7 different types of fertility methods and devices.

cycle 53_1701120622760017610480320543813112..png

My Original Experience with Tempdrop in 2018

I used the Tempdrop device for almost 12 months. I found my oral temps to be more predictable and more steady when observing my own trends over time. I get very steady or repeating temperatures with oral charts most of the time.

However, I am not a shift worker, so I will admit that I do not need Tempdrop like some people may do. I already have to wake up at the same time 5 days a week, and I don’t find it inconvenient to take my temperature on the weekend. Even if I take my temperature later, my oral temperatures are incredibly steady. My oral temperatures also caught my shift earlier than Tempdrop did on two separate occasions (I have seen other people say that Tempdrop catches their shift sooner than oral temperatures, so this is really an individual thing).

Funnily, alcohol appears to effect my Tempdrop temperatures MORE than my oral temperatures. I speculate that this is because whenever I would put the Tempdrop on, I was still recently drinking and hotter due to the alcohol. In contrast, I would be sleeping for 8-9 hours and have worn off the alcohol before taking my oral temperature.

Here is one full cycle comparison:

Tempdrop (Ovuview)

ovuview

Oral Temperatures (Kindara)

kindaraoral

Tempdrop temperatures will either read higher or lower than your oral temperatures. In my case, they read much higher.

Want to try it yourself?

Use this link and get 10% off the device. This discount only works on the Confidence and Freedom Packages.

Full disclosure: I will get a $10 USD kickback if you use my coupon. Thanks for using it!

Continue reading An Honest Review of Tempdrop