A Dive Into Resting Heart Rate and the Menstrual Cycle

I purchased a Fitbit device close to two years ago, and within months I noticed that my heart rate appeared to be correlating with the phases of my cycle. I’ve been charting resting heart rate since 2018, and I can say with confidence that it has lined up every cycle. This shouldn’t be too surprising because we already know that progesterone causes basal body temperature to rise, but heart rate does not exactly follow that pattern. Heart Rate also rises in response to high estrogen levels in the fertile window.

We have known about the possible connection between heart rate and the menstrual cycle for over a century, but in the last 50 years a few studies have taken a closer look.

Palmero (1991) studied 64 women for 3 consecutive months and created a PMS group versus a non-PMS group. They found that “in the premenstrual phase, PMS group showed significantly higher resting HR levels than NPMS group.”

Moran (2000) followed 26 women and found that “resting-heart rate was significantly higher in both ovulatory (P < 0.01) and luteal (P < 0.01) phases than in the menstrual and follicular phases.”

Shilaih (2017) followed 91 women and found that they “observed a significant increase in pulse rate (PR) during the fertile window compared to the menstrual phase (2.1 beat-per-minute, p < 0.01). Moreover, PR during the mid-luteal phase was also significantly elevated compared to the fertile window (1.8 beat-per-minute, p < 0.01), and the menstrual phase (3.8 beat-per-minute, p < 0.01).”

I want to highlight these last two studies in particular, because many of the other studies have an issue. Marco Altino explains why:

“The great majority of studies looking at HRV and the menstrual cycle collected one single data point during the follicular phase and one single data point during the luteal phase. I don’t have to tell you how little sense that makes, considering the high day to day variability in these parameters.”

This is an excerpt from his blog on heart rate variability in the menstrual cycle. Read the full blog here.

The 2017 study published in Nature by Shilaih, et al found that heart rate may rise up to 5 days before ovulation occurs. This means that heart rate could potentially be a used as a way to time intercourse for conception.

My results are so steady with resting heart rate that I dream of someone using it in a long-term study with other fertility signs. Wouldn’t it be cool if we could avoid pregnancy using heart rate too?

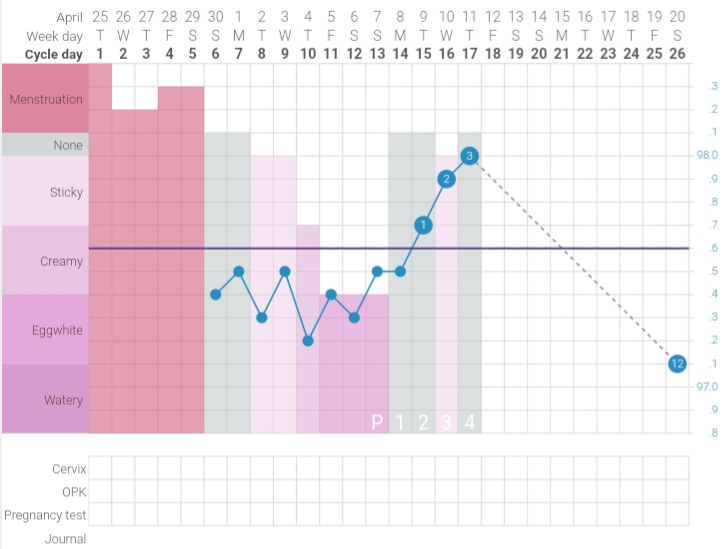
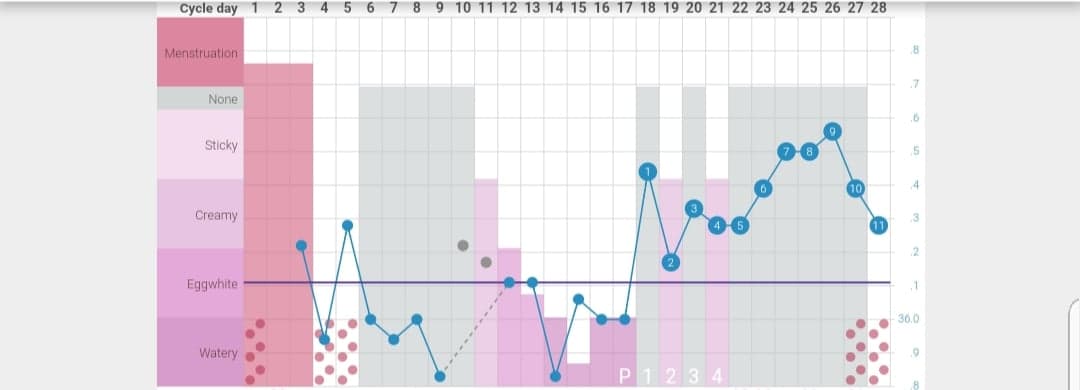
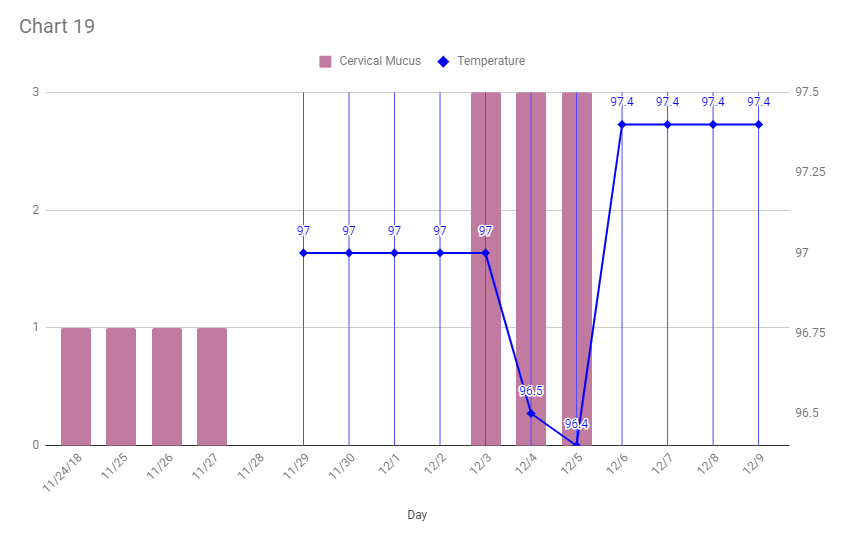
Below is an example of my results with resting heart rate. To convert my heart rate to fit in a fertility awareness app, I use a conversion. Essentially, one heart rate beat = .1 Farenheit change on my temperature scale. A heartbeat of 69 becomes 96.9, 70 becomes 97.0, 71 becomes 97.1 This preserves the original ratio, and it allows me to show the data with other fertility signs. For your own conversion, you may model this. If you have a lower heart beat rate, you can still convert, but you may need to do an additional equation.

My resting heart rate rose during the most fertile days of the cycle. Ovulation most likely occured on Cycle Day 15 or Cycle Day 16 on this chart. In addition, while I have not found evidence of this in the literature, I have observed that I tend to get a one day rise 3 to 4 days before the fertile window opens with cervical mucus. On this chart, that was Cycle Day 6.
A second example. Ovulation most likely occured on Cycle Day 14, 15 or 16. Heart rate rose on Cycle Day 14.

In conclusion, I believe that resting heart rate is a very unique sign to track, especially if you already use a wearable fitness tracker. I will note that a false heart rate rise can be caused by illness, alcohol or food close to bedtime, nightmares, and more! This is not dissimilar to what can obscure a temperature. I hope that in the future more studies are done so that we can see if heart rate can also be used for avoiding pregnancy purposes.

Selected Heart Rate Study Citations

Moran, V. H., Leathard, H. L., & Coley, J. (2000). Cardiovascular functioning during the menstrual cycle. Clinical physiology (Oxford, England)20(6), 496–504. https://doi.org/10.1046/j.1365-2281.2000.00285.x

Palmero, F., Choliz, M. Resting heart rate (HR) in women with and without premenstrual symptoms (PMS). J Behav Med 14, 125–139 (1991). https://doi.org/10.1007/BF00846175

Shilaih, M., Clerck, V., Falco, L. et al. Pulse Rate Measurement During Sleep Using Wearable Sensors, and its Correlation with the Menstrual Cycle Phases, A Prospective Observational Study. Sci Rep 7, 1294 (2017). https://doi.org/10.1038/s41598-017-01433-9

Shortcut charting, or “Wait… I don’t have to take my temperature every day?”

Many people come into FAM overwhelmed by all the data that they have to collect daily. It can be a bit of a turn off for those new to the method. They may wonder why they have to check their cervical mucus ALL day and then set an alarm on top of that.

When you first begin charting, it is vitally important to try to get the information down every day so that you can get into a habit and make sure that you are following the rules. Missing information will leave you with less complete charts that could leave you confused as to whether ovulation is confirmed or not.

However, once you have been charting for a significant amount of time and become confident, you can stop recording fertility signs once you have confirmed ovulation.

I am headed into chart number twenty-two successfully avoiding pregnancy with FAM, and I have been shortcut charting most of the time for about seven cycles now. I personally recommend confirming ovulation in 12 cycles before shortcut charting. This is so that you know how early you ovulate, your normal temperature levels, and how to tell whether something abnormal is going on in your cycle (ie sickness causing temperatures to be higher than normal or an abnormal cervical fluid dry up due to cold meds or some other medication).

Toni Weschler, author of Taking Charge of Your Fertility, recommends that women have several months of experience in the standard rules before taking any shortcuts. She offers some modified guidelines to follow and emphasizes that “contraceptive efficacy won’t be compromised as long as both your fertility signs have confirmed that ovulation has already been confirmed for that particular cycle.”

The Modified Rules

Temperature Taking

  1. You don’t have to take your temperature during your period. Toni explains that these temps may be unreliable anyways. However, if you have short cycles with early ovulation, you may need those temps in order to confirm ovulation. If you have a temperature shift CD12 or sooner, you will need some period temps in order to have enough temperatures to draw a coverline.
  2. You don’t have to take your temperature after you confirm ovulation with temperature rules. This means at least 3 high temperatures with a standard shift. If you have weak shift or a fall back rise, you must have the extra temperatures needed to fulfill those rules before you stop taking your temperature. Some people take their temperature again a day or two before they expect their period since it can (but not always) give an indication that menstruation is approaching.

Cervical Mucus

  1. You don’t have to check cervical mucus after you confirm ovulation. You will need to check until you meet peak rules (P + 3) and crosscheck this with 3 high temperatures before you can stop checking for cervical mucus. Again, if you have a weak shift or fallback, you will need to check until you meet the rules.
  2. From the day after your period until the day you observe peak type fluid, you should check cervical mucus continuously throughout the day and follow all rules for mucus checks. However, you don’t have to check cervical mucus multiple times a day once you observe peak fluid. If you observe peak fluid first thing in the morning, there is no need to keep checking. You have already recorded your most fertile observation for the day.

Those are the basic changes when short cut charting.

Here is an example chart.

This woman does not take her temperatures during her period. She begins taking her temperature on CD6 when menstruation ends. She checks her cervical mucus multiple times a day and follows the rules for checking until CD11. On CD11, CD12, and CD13, she observes eggwhite mucus first thing in the morning and doesn’t check again. On CD14-CD17, she checks mucus multiple times a day because she knows she needs at least a 3 day dry up (P + 3) to confirm ovulation. On CD 15, she has her temperature shift. CD16 is above the coverline. CD17 confirms ovulation because it is at least .4 F above the coverline. Ovulation is officially confirmed with both peak and temperature rules met. She takes her temperature again on CD26 to see if she gets a temperature drop indicating that her menstruation may begin soon.

People Who May Want to Think Twice about Short Cut Charting

Not everyone is suited to short cut charting.

  • Charting for Health: If you are charting for health, you may want to record your signs every day. Odd cervical mucus patterns and temperatures can indicate health issues. If this is your goal for charting, short cut charting may not be right for you.
  • Using Tempdrop: Tempdrop says to wear the device every day. If you don’t, it could disrupt the algorithm. As far as I know, they do not recommend short cut charting at this time. If you use this device, you may not want to short cut chart if you are worried about being at risk of pregnancy.
  • You aren’t confident in charting: If you are not confident in your ability to chart, you should NOT short cut chart. You should be 100% confident in your abilities before attempting this.
  • You are sick: If you are sick, you may want to chart more diligently and stay protected if you are uncertain about your chart interpretation.
  • You are only charting one sign: You NEED two signs in order to short cut chart. If you pick just one, you may be putting yourself at risk of unintended pregnancy. Ovulation must be confirmed with two signs.

Top 3 Fertility Awareness Mobile Charting Apps

One of the first steps many women take when starting their charting journey is downloading a period app. However, not all apps are created equal. A quick search in the app store comes up with dozens of apps. Sadly, very few of them are suitable for those using NFP or FAM. Most are just forms of the rhythm method, an unreliable from of birth control that comes up with predictions based on past cycles. My review only includes apps that allow women to track cervical mucus and basal body temperature–the two main signs in SymptoThermal Methods. I also tried to only pick apps that allowed self-interpretation. Learning how to interpret your own fertility signs is vitally important when charting.

1. Kindara

kindara2

Available on Android and iPhone.

Perk: The iPhone version allows users to share their whole chart.

Con: The Android version is known to be considerably more glitchy than the iPhone version. On Android, users can select “Share This Chart” and “With Community” to access a screen where they may screenshot their own chart.

Cost

Perk: Free Version Available

Con: Vaginal Sensation and more than four categories are extra. Premium version is $4.99 USD/month or $49.99 USD/year


SymptoThermal Rules Interpretation

Perk: I don’t know if Kindara has a monopoly on self-interpretation or what, but it’s one of the only apps to allow users to interpret and mark their own peak day and temperature shift. It also lets users mark their own coverline. This means that Kindara is good for those using a method like Taking Charge of Your Fertility (which has a higher coverline) and those using Sensiplan (which has a lower coverline). Lastly, Kindara has a very easy to read, clear chart. This is so important for users, and for those helping them.

Predictions

Kindara also does not predict fertile windows unless the user is trying to conceive (I recommend ignoring these even if trying to conceive. It is always best to do your own interpretations or ask an instructor if uncertain). It will predict menstruation based on average luteal phase length once it has enough data.

Other Features:

  • Users may share charts and get feedback from the community
  • Counts days past ovulation when shift is marked
  • Cervix Tracking (Height, Openness,Firmness)
  • Sex Tracking (Protected, Unprotected, Withdrawal, Insemination
  • OPK and Pregnancy Tests Tracking
  • Journal Available
  • Pairs with Wink Thermometer (syncs with the app via Bluetooth)
  • Emojis can be used in custom data

2. Fertility Friend

fertlity friend

Available on Android and iPhone 

Pro: Fertility Friend appears to work equally well on Android and iPhone

Cost

Pro: Free, paying is not necessary to be able to chart.

Con: VIP membership available starting at $9.99/month. This is a little expensive. The community sharing feature is only available to those who pay.

SymptoThermal Rules Interpretation

Perk: Coverline can be overridden under settings.  There are options to chart cervical mucus and temperatures.

Con: The app automatically interprets. For new users, this may be confusing. 

Predictions

Fertility Friend does predict fertile windows, period days, ovulation days, and a recommended test day for pregnancy. As always, users should rely on their own interpretations and get help from an instructor if needed.

Other Features:

  • Cervix Tracking (Height, Openness, Firmness)
  • Pregnancy and OPK tracking
  • Ton of Options for Mood, Health, Diet
  • Options for IVF, A.R.T., and Fertility Medication Tracking
  • Weight Data
  • Lightbox (With VIP compare photos of OPK and HPT tests)
  • Chart Overlay (Compare multiple cycles on one chart)
  • Sex Tracking (no option to differentiate unprotected versus protected)

3. OvuView

ovuview

Available on Android Only

Con: Pretty much the fact that it isn’t available on Apple products

Cost

Perk: Free (but with ads). One time payment of $4.99 to remove all ads. This is the cheapest app with the most features for custom tracking.

SymptoThermal Rules Interpretation

Perk: You can pick from multiple methods. Users may turn methods on and off.

Con: No self interpretation available. I have included it because unlike any other app that I have come across that interprets for users, the methods can be turned off. Users may play around with the methods to see if they can mark their chart according to their method’s rules. Turning off all settings would leave a chart for the user to interpret themselves even though they can’t self-mark.  Another con is that the temperature scale is very hard to read. Make sure to round or drop your temps. Ovuview may not always do this correctly.

Predictions

Ovuview predicts future fertile windows, ovulation days, and periods. Users should ignore this in favor of self-interpretation.

Other Features:

  • A ton of custom tracking like medications, moods, weight, etc.
  • Syncs with the Tempdrop device (This is wearable BBT. My review is coming soon. Full disclosure: this link earns me ten dollars if you use it to purchase the device)
  • Cool design. Users can choose their own chart colors, background, custom data colors, etc.
  • Cervix Tracking (Position, Opening, Texture)
  • OPK and Pregnancy Test Tracking
  • Fertility Monitor Tracking (None, Low, High, Peak)
  • Sex Tracking

Conclusion

There are limited options for self-interpretation when it comes to FAM apps. The three apps above are the best I’ve found when it comes to self-marking.

Look out for my next blog on how to chart using Google Sheets. I’ll be creating a Youtube video on how to do this yourself. This method of charting allows self-interpretation, custom data tracking, and users can chart on their computer or phone.

Google Sheets

chart 19

chart192